robgibbon
on 15 July 2024
Move over Hadoop, it’s time for Spark on Kubernetes
Apache Spark, a framework for parallel distributed data processing, has become a popular choice for building streaming applications, data lake houses and big data extract-transform-load data processing (ETL). It is horizontally scalable, fault-tolerant, and performs well at high scale. Historically, Spark and Apache Hadoop have gone hand-in-hand for big data; however, managing and scaling Spark jobs running on Hadoop clusters could be challenging and often time-consuming for many reasons, but surely at least due to the availability of physical systems and configuring the Kerberos security protocol that Hadoop uses. But there is a new kid in town – Kubernetes – as an alternative to Apache Hadoop. Kubernetes is an open-source platform for deployment and management of nearly any type of containerized application. In this article we’ll walk through the process of deploying Apache Spark on AWS, using Amazon Elastic Kubernetes Service (EKS) with Canonical’s Charmed Spark solution.
Kubernetes provides a robust foundation platform for Spark based data processing jobs and applications. Versus Hadoop, it offers more flexible security and networking models, and a ubiquitous platform that can co-host auxiliary applications that complement your Spark workloads – like Apache Kafka or MongoDB. Best of all, most of the key capabilities of Hadoop YARN are also available to Kubernetes – such as gang scheduling – through Kubernetes extensions like Volcano.
You can launch Spark jobs on a Kubernetes cluster directly from the Spark command line tooling, without the need for any extras, but there are some helpful extra components that can be deployed to Kubernetes with an operator. An operator is a piece of software that “operates” the component for you – taking care of deployment, configuration and other tasks associated with the component’s lifecycle.
With no further ado, let’s learn how to deploy Spark on Amazon EKS using Juju charms from Canonical. Juju is an open-source orchestration engine for software operators that helps customers to simplify working with sophisticated, distributed applications like Spark on Kubernetes and on cloud servers.
To get a Spark cluster environment up and ready on EKS, we’ll use the spark-client and juju snaps. Snaps are applications bundled with their dependencies, able to work across a wide range of Linux distributions without modifications. It is a hardened software packaging format with an enhanced security posture. You can learn more about snaps at snapcraft.io.

Solution overview
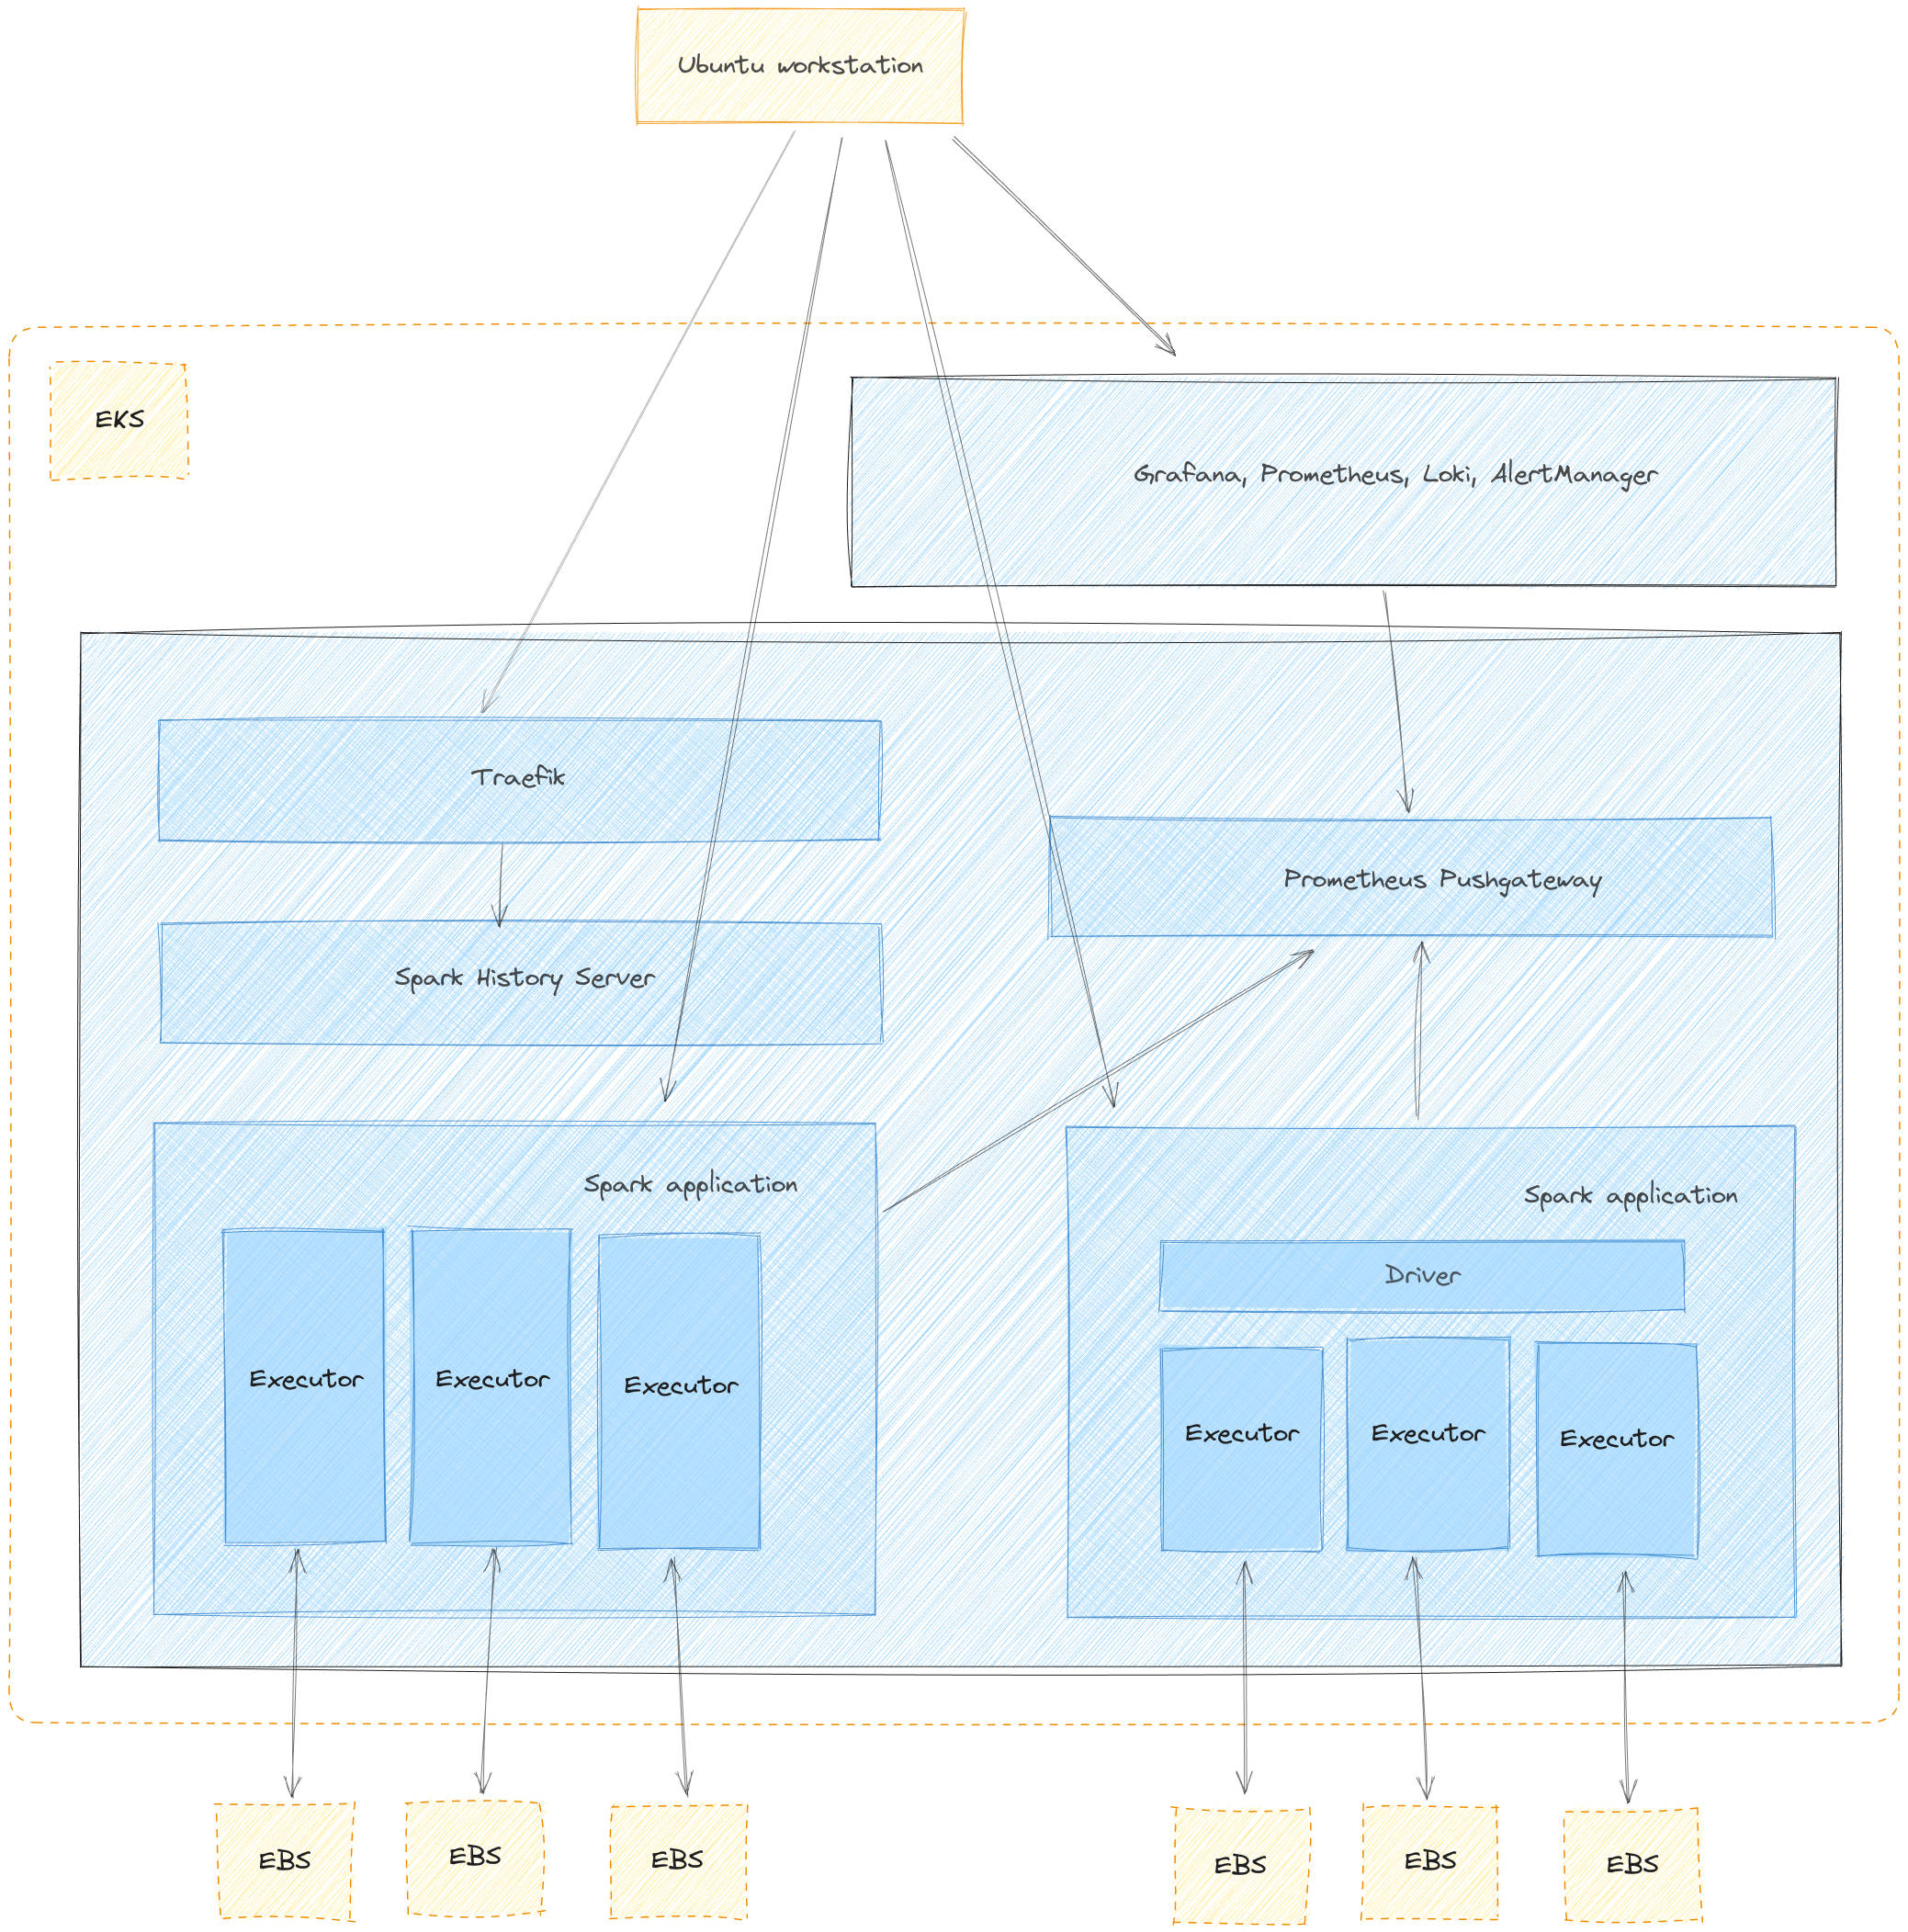
The following diagram shows the solution that we will implement in this post.

In this post, you will learn how to provision the resources depicted in the diagram from your Ubuntu workstation. These resources are:
- A Virtual Private Cloud (VPC)
- An Amazon Elastic Kubernetes Service (Amazon EKS) Cluster with one node group using two spot instance pools
- Amazon EKS Add-ons: CoreDNS, Kube_Proxy, EBS_CSI_Driver
- A Cluster Autoscaler
- Canonical Observability Stack deployed to the EKS cluster
- Prometheus Push Gateway deployed to the EKS cluster
- Spark History Server deployed to the EKS cluster
- Traefik deployed to the EKS cluster
- An Amazon EC2 edge node with the spark-client and juju snaps installed
- An S3 bucket for data storage
- An S3 bucket for job log storage
Walkthrough
Prerequisites
Ensure that you are running an Ubuntu workstation, have an AWS account, a profile with administrator permissions configured and the following tools installed locally:
- Ubuntu 22.04 LTS
- AWS Command Line Interface (AWS CLI)
- kubectl snap
- eksctl
- spark-client snap
- juju snap
Deploy infrastructure
You will need to set up your AWS credentials profile locally before running AWS CLI commands. Run the following commands to deploy the environment and EKS cluster. The deployment should take approximately 20 minutes.
snap install aws-cli --classic
snap install juju
snap install kubectl

aws configure
# enter the necessary details when prompted

wget https://github.com/eksctl-io/eksctl/releases/download/v0.173.0/eksctl_Linux_amd64.tar.gz
tar xzf eksctl_Linux_amd64.tar.gz
cp eksctl $HOME/.local/bin

cat > cluster.yaml <<EOF
apiVersion: eksctl.io/v1alpha5
kind: ClusterConfig

metadata:
    name: spark-cluster
    region: us-east-1
    version: "1.29"
iam:
  withOIDC: true

addons:
- name: aws-ebs-csi-driver
  wellKnownPolicies:
    ebsCSIController: true

nodeGroups:
    - name: ng-1
      minSize: 2
      maxSize: 5
      iam:
        withAddonPolicies:
          autoScaler: true
        attachPolicyARNs:
        - arn:aws:iam::aws:policy/AmazonEKSWorkerNodePolicy
        - arn:aws:iam::aws:policy/AmazonEKS_CNI_Policy
        - arn:aws:iam::aws:policy/AmazonEC2ContainerRegistryReadOnly
        - arn:aws:iam::aws:policy/AmazonSSMManagedInstanceCore
        - arn:aws:iam::aws:policy/AmazonS3FullAccess
      instancesDistribution:
        maxPrice: 0.15
        instanceTypes: ["m5.xlarge", "m5.large"]
        onDemandBaseCapacity: 0
        onDemandPercentageAboveBaseCapacity: 50
        spotInstancePools: 2
EOF

eksctl create cluster --ssh-access -f cluster.yaml
Verify the deployment
List Amazon EKS nodes
The following command will update the kubeconfig on your local machine and allow you to interact with your Amazon EKS Cluster using kubectl to validate the deployment.
aws eks --region $AWS_REGION update-kubeconfig --name spark-on-eksCheck if the deployment has created two nodes.
kubectl get nodes -l 'NodeGroupType=ng01'

# Output should look like below
NAME  STATUS  ROLES AGE  VERSION
ip-10-1-0-100.us-west-2.compute.internal   Ready    <none>   62m   v1.27.7-eks-e71965b
ip-10-1-1-101.us-west-2.compute.internal   Ready    <none>   27m   v1.27.7-eks-e71965b
Configure Spark History Server
Once the cluster has been created, you will need to adapt the kubeconfig configuration file so that the spark-client tooling can use it.
TOKEN=$(aws eks get-token --region us-east-1 --cluster-name spark-cluster --output json)

sed -i "s/^\ \ \ \ token\:\ .*$/^\ \ \ \ token\:\ $TOKEN/g" $HOME/.kube/config
The following commands create buckets on S3 for spark’s data and logs.
aws s3api create-bucket --bucket spark-on-eks-data --region us-east-1
aws s3api create-bucket --bucket spark-on-eks-logs --region us-east-1
The next step is to configure Juju so that we can deploy the Spark History Server. Run the following commands:
cat $HOME/.kube/config | juju add-k8s eks-cloud

juju add-model spark eks-cloud
juju deploy spark-history-server-k8s --channel=3.4/stable
juju deploy s3-integrator
juju deploy traefik-k8s --trust
juju deploy prometheus-pushgateway-k8s --channel=edge

juju config s3-integrator bucket="spark-on-eks-logs" path="spark-events"
juju run s3-integrator/leader sync-s3-credentials access-key=${AWS_ACCESS_KEY_ID} secret-key=${AWS_SECRET_ACCESS_KEY}
juju integrate s3-integrator spark-history-server-k8s
juju integrate traefik-k8s spark-history-server-k8s
Configure monitoring
We can integrate our Spark jobs with our monitoring stack. Run the following commands to deploy the monitoring stack and integrate the Prometheus Pushgateway.
juju add-model observability eks-cloud

curl -L https://raw.githubusercontent.com/canonical/cos-lite-bundle/main/overlays/storage-small-overlay.yaml -O

juju deploy cos-lite \
  --trust \
  --overlay ./storage-small-overlay.yaml

juju deploy cos-configuration-k8s --config git_repo=https://github.com/canonical/charmed-spark-rock --config git_branch=dashboard \
  --config git_depth=1 --config grafana_dashboards_path=dashboards/prod/grafana/
juju-wait

juju integrate cos-configuration-k8s grafana

juju switch spark
juju consume admin/observability.prometheus prometheus-metrics
juju integrate prometheus-pushgateway-k8s prometheus-metrics
juju integrate scrape-interval-config prometheus-pushgateway-k8s
juju integrate scrape-interval-config:metrics-endpoint prometheus-metrics

PROMETHEUS_GATEWAY_IP=$(juju status --format=yaml | yq ".applications.prometheus-pushgateway-k8s.address")
Create and run a sample Spark job
Spark jobs are data processing applications that you develop using either Python or Scala. Spark jobs distribute data processing across multiple Spark executors, enabling parallel, distributed processing so that jobs complete faster.
We’ll start an interactive session that launches Spark on the cluster and allows us to write a processing job in real time. First we’ll set some configuration for our spark jobs.
cat > spark.conf <<EOF
spark.eventLog.enabled=true
spark.hadoop.fs.s3a.aws.credentials.provider=org.apache.hadoop.fs.s3a.SimpleAWSCredentialsProvider
spark.hadoop.fs.s3a.connection.ssl.enabled=true
spark.hadoop.fs.s3a.path.style.access=true
spark.hadoop.fs.s3a.access.key=${AWS_ACCESS_KEY_ID}
spark.hadoop.fs.s3a.secret.key=${AWS_SECRET_ACCESS_KEY}
spark.eventLog.dir=s3a://spark-on-eks-logs/spark-events/
spark.history.fs.logDirectory=s3a://spark-on-eks-logs/spark-events/
spark.driver.log.persistToDfs.enabled=true
spark.driver.log.dfsDir=s3a://spark-on-eks-logs/spark-events/
spark.metrics.conf.driver.sink.prometheus.pushgateway-address=${PROMETHEUS_GATEWAY_IP}:9091
spark.metrics.conf.driver.sink.prometheus.class=org.apache.spark.banzaicloud.metrics.sink.PrometheusSink
spark.metrics.conf.driver.sink.prometheus.enable-dropwizard-collector=true
spark.metrics.conf.driver.sink.prometheus.period=1
spark.metrics.conf.driver.sink.prometheus.metrics-name-capture-regex=([a-zA-Z0-9]*_[a-zA-Z0-9]*_[a-zA-Z0-9]*_)(.+)
spark.metrics.conf.driver.sink.prometheus.metrics-name-replacement=\$2
spark.metrics.conf.executor.sink.prometheus.pushgateway-address=${PROMETHEUS_GATEWAY_IP}:9091
spark.metrics.conf.executor.sink.prometheus.class=org.apache.spark.banzaicloud.metrics.sink.PrometheusSink
spark.metrics.conf.executor.sink.prometheus.enable-dropwizard-collector=true
spark.metrics.conf.executor.sink.prometheus.period=1
spark.metrics.conf.executor.sink.prometheus.metrics-name-capture-regex=([a-zA-Z0-9]*_[a-zA-Z0-9]*_[a-zA-Z0-9]*_)(.+)
spark.metrics.conf.executor.sink.prometheus.metrics-name-replacement=\$2
EOF

spark-client.service-account-registry create --username spark --namespace spark --primary --properties-file spark.conf --kubeconfig $HOME/.kube/config
Start a Spark shell
To start an interactive pyspark shell, you can run the following command. This will enable you to interactively run commands from your Ubuntu workstation, which will be executed in a spark session running on the EKS cluster. In order for this to work, the cluster nodes need to be able to route IP traffic to the Spark “driver” running on your workstation. To enable routing between your EKS worker nodes and your Ubuntu workstation, we will use sshuttle.
sudo apt install sshuttle
eks_node=$(kubectl get nodes -l 'NodeGroupType=ng01' -o wide | tail -n 1 | awk '{print $7}')
sshuttle --dns -NHr ec2-user@${eks_node} 0.0.0.0/0
eks-node
Now open another terminal and start a pyspark shell:
spark-client.pyspark --username spark --namespace sparkYou should see output similar to the following:
Welcome to
      ____              __
     / __/__  ___ _____/ /__
    _\ \/ _ \/ _ `/ __/  '_/
   /__ / .__/\_,_/_/ /_/\_\   version 3.4.2
      /_/

Using Python version 3.10.12 (main, Nov 20 2023 15:14:05)
Spark context Web UI available at http://10.1.0.1:4040
Spark context available as 'sc' (master = k8s://https://10.1.0.15:16443, app id = spark-83a5f8365dda47d29a60cac2d4fa5a09).
SparkSession available as 'spark'.
>>>
Write a Spark job
From the interactive pyspark shell, we can write a simple demonstration job that will be processed in a parallel, distributed manner on the EKS cluster. Enter the following commands:
lines = """Canonical's Charmed Data Platform solution for Apache Spark runs Spark jobs on your Kubernetes cluster.
You can get started right away with MicroK8s - the mightiest tiny Kubernetes distro around!
The spark-client snap simplifies the setup process to get you running Spark jobs against your Kubernetes cluster.
Spark on Kubernetes is a complex environment with many moving parts.
Sometimes, small mistakes can take a lot of time to debug and figure out.
"""

def count_vowels(text: str) -> int:
  count = 0
  for char in text:
    if char.lower() in "aeiou":
      count += 1
  return count

from operator import add
spark.sparkContext.parallelize(lines.splitlines(), 2).map(count_vowels).reduce(add)
To exit the pyspark shell, type quit().
Access Spark History Server
To access the Spark History Server, we’ll use a Juju command to get the URL for the service, which you can copy and paste into your browser:
juju run traefik-k8s/leader -m spark show-proxied-endpoints

# you should see output like
Running operation 53 with 1 task
  - task 54 on unit-traefik-k8s-0

Waiting for task 54...
proxied-endpoints: '{"spark-history-server-k8s": {"url": "https://10.1.0.186/spark-model-spark-history-server-k8s"}}'
You should see a URL in the response which you can use in order to connect to the Spark History Server.
Scaling your Spark cluster
The ability to scale a Spark cluster can be useful because scaling out the cluster by adding more capacity allows the cluster to run more Spark executors in parallel. This means that large jobs can be completed faster. Furthermore, more jobs can run concurrently at the same time.
Spark is designed to be scalable. If you need more capacity at certain times of the day or week, you can scale out by adding nodes to the underlying Kubernetes cluster or scale in by removing nodes. Since data is persisted externally to the Spark cluster in S3, there is limited risk of data loss. This flexibility allows you to adapt your system to meet changing demands and ensure optimal performance and cost efficiency.
To run a spark job with dynamic resource scaling, use the additional configuration parameters shown below.
spark-client.spark-submit \
…
--conf spark.dynamicAllocation.enabled=true \
--conf spark.dynamicAllocation.shuffleTracking.enabled=true \
--conf spark.dynamicAllocation.shuffleTracking.timeout=120 \
--conf spark.dynamicAllocation.minExecutors=10 \
--conf spark.dynamicAllocation.maxExecutors=40 \
--conf spark.kubernetes.allocation.batch.size=10 \
--conf spark.dynamicAllocation.executorAllocationRatio=1 \
--conf spark.dynamicAllocation.schedulerBacklogTimeout=1 \
…
The EKS cluster is already configured to support auto scaling of the node group, so that as demand for resources from Spark jobs increases, additional EKS worker nodes are brought online.
View Spark job stats in Grafana
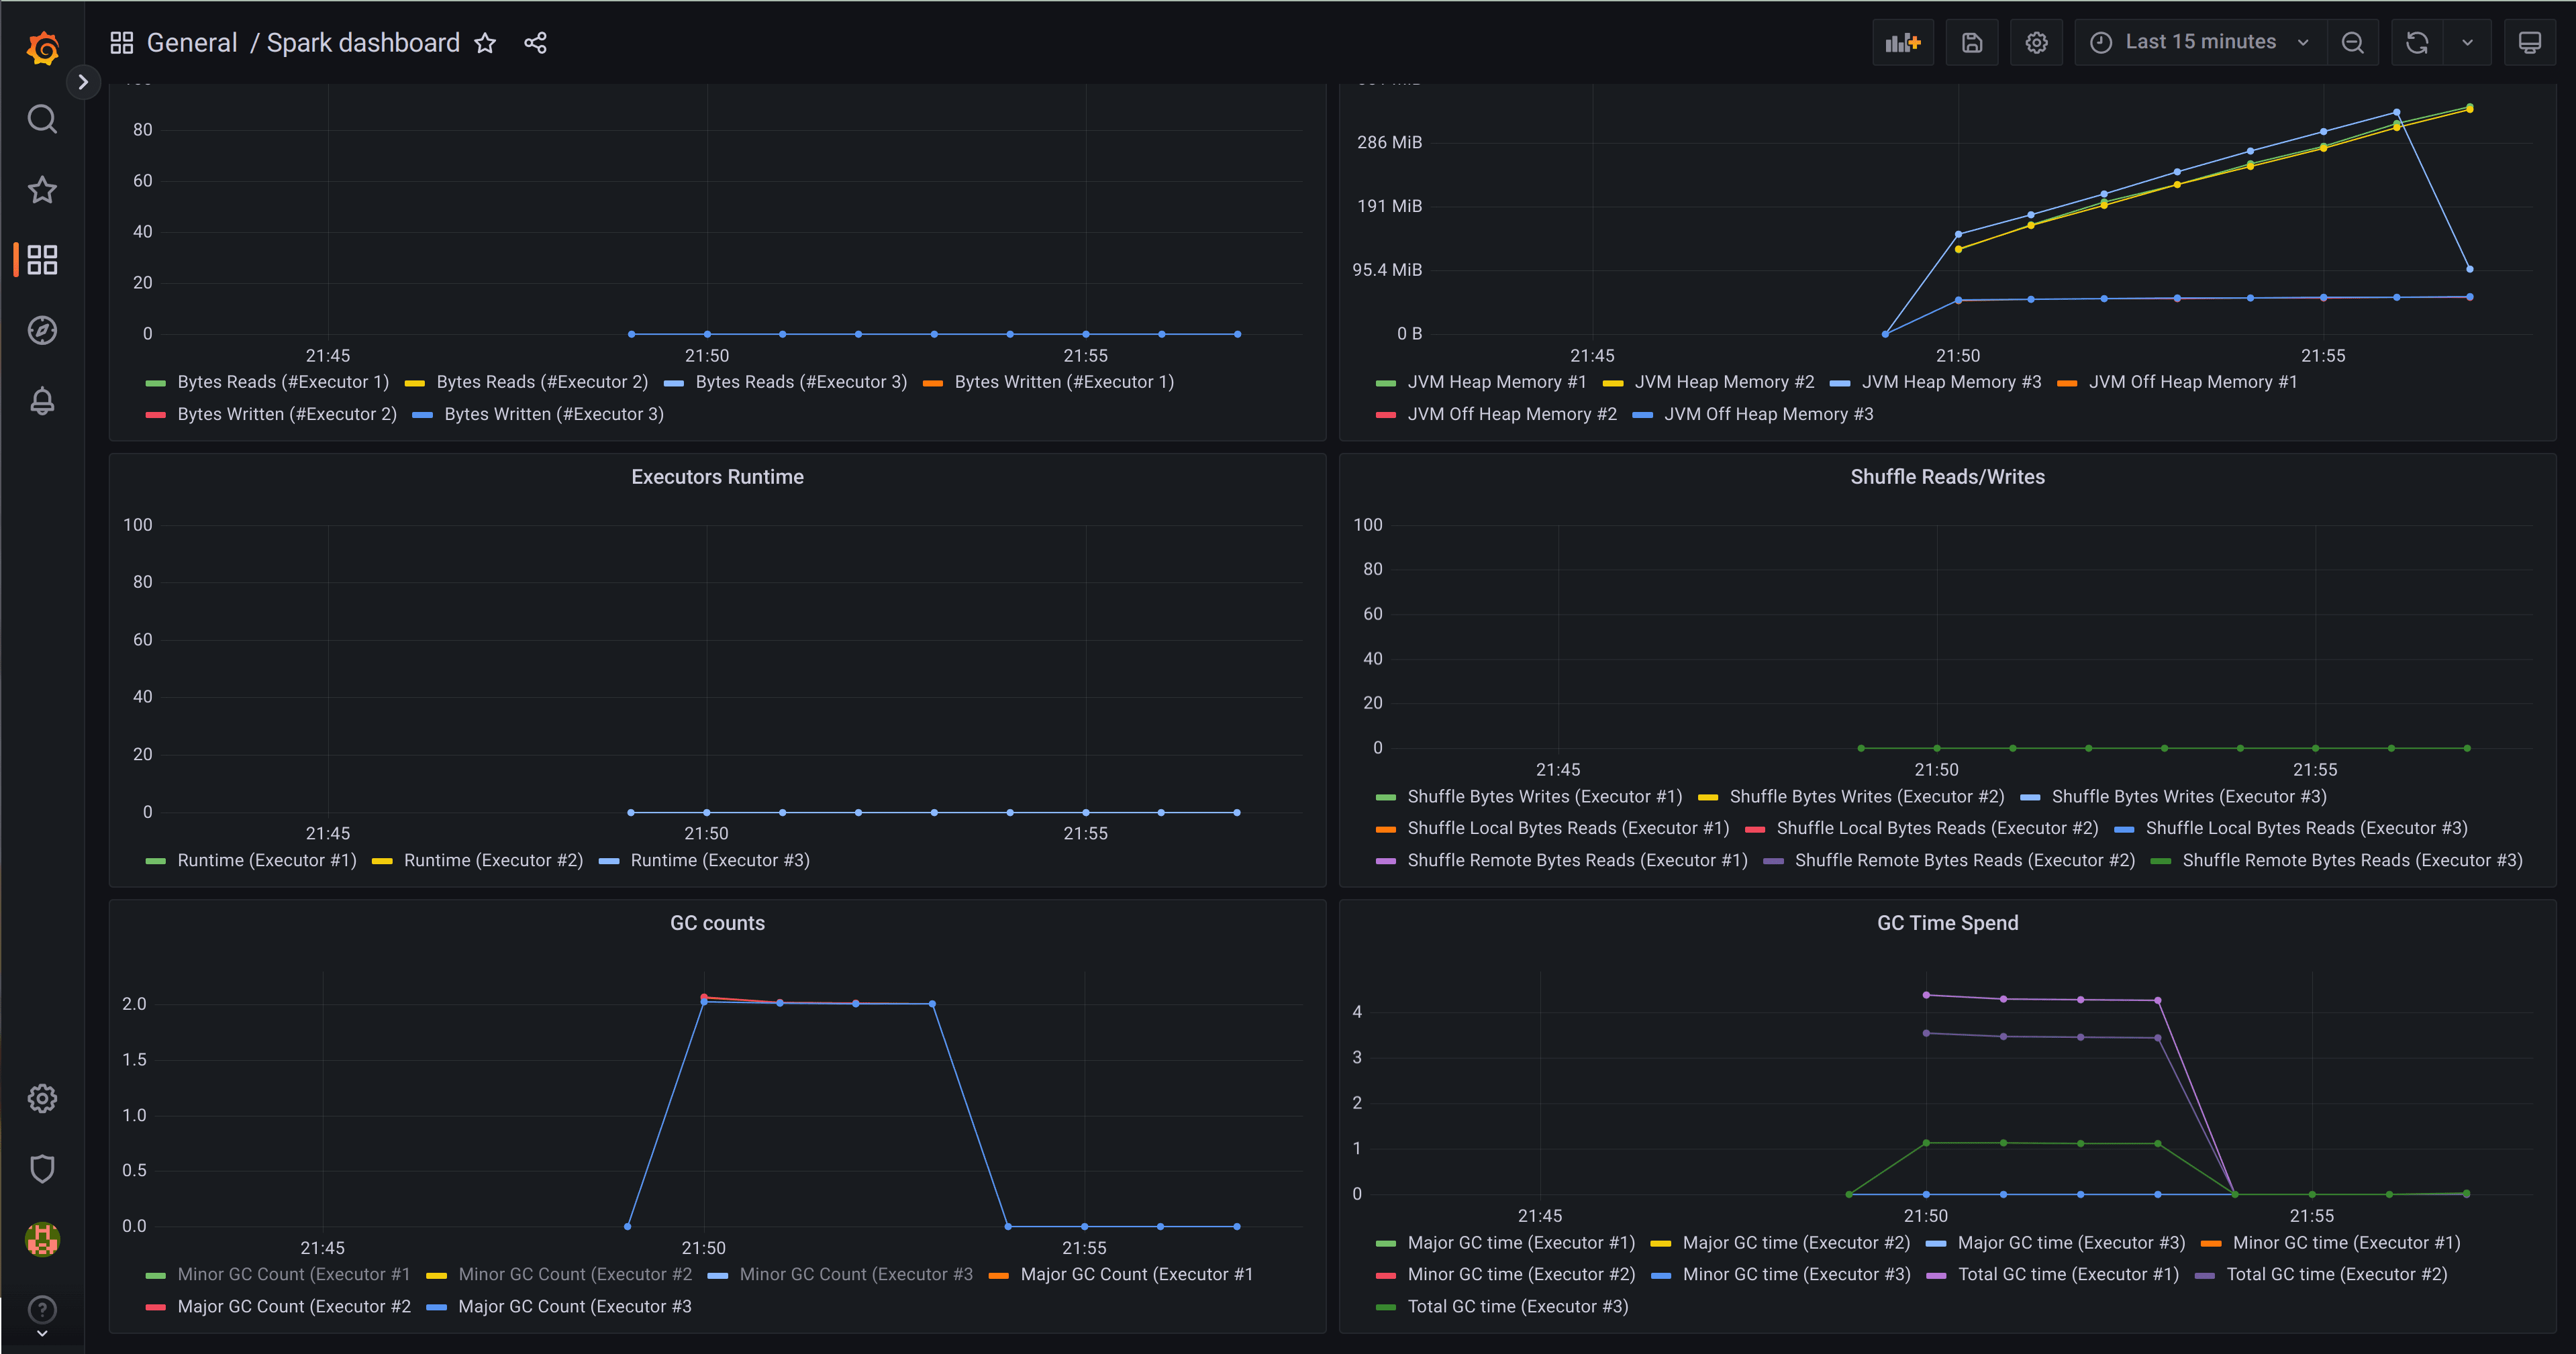
The solution installs Canonical Observability Stack (COS), which includes Prometheus and Grafana, and comes with ready to use Grafana dashboards. You can fetch the secret for login as well as the URL to the Grafana Dashboard by running the following command:
juju switch observability
juju run grafana/leader get-admin-password
Enter admin as username and the password from the previous command.
Open Spark dashboard
Navigate to the Spark dashboard. You should be able to see metrics from long running Spark jobs.

Conclusion
In this post, we saw how to deploy Spark on Amazon EKS with autoscaling. Additionally, we explored the benefits of using Juju charms to rapidly deploy and manage a complete Spark solution. If you would like to learn more about Charmed Spark – Canonical’s supported solution for Apache Spark, then you can visit the Charmed Spark product page, contact the commercial team, or chat with the engineers on Matrix.


